
Logistic Regression
In this blog I will be writing about Logistic Regression, that is, what is Logistic regression, Cost function, Threshold, checking goodness of fit etc.
What is Logistic Regression?
The logistic regression statistic modeling technique is used when we have a binary outcome variable. For example: given the parameters, will the student pass or fail? Will it rain or not? etc.
So, though we may have continuous or categorical independent variables, we can use the logistic regression modeling technique to predict the outcome when the outcome variable is binary.

Let's see how the algorithm differs from linear regression. Linear regression statistical model is used to predict continuous outcome variables, Whereas logistic regression predicts categorical outcome variables. Linear regression model regression line is highly susceptible to outliers. So, it will not be appropriate for logistic regression.
Where to use logistic regression
Logistic regression is used to solve classification problems, and the most common use case is binary logistic regression, where the outcome is binary (yes or no). In the real world, you can see logistic regression applied across multiple areas and fields.
- In health care, logistic regression can be used to predict if a tumor is likely to be benign or malignant.
- In the financial industry, logistic regression can be used to predict if a transaction is fraudulent or not.
- In marketing, logistic regression can be used to predict if a targeted audience will respond or not.
Are there other use cases for logistic regression aside from binary logistic regression? Yes. There are two other types of logistic regression that depend on the number of predicted outcomes.
The three types of logistic regression
- Binary logistic regression - When we have two possible outcomes, like our original example of whether a person is likely to be infected with COVID-19 or not.
- Multinomial logistic regression - When we have multiple outcomes, say if we build out our original example to predict whether someone may have the flu, an allergy, a cold, or COVID-19.
- Ordinal logistic regression - When the outcome is ordered, like if we build out our original example to also help determine the severity of a COVID-19 infection, sorting it into mild, moderate, and severe cases.
Mathematics behind Best fitted line in logistic regression
Probability always ranges between 0 (does not happen) and 1 (happens). Using our Covid-19 example, in the case of binary classification, the probability of testing positive and not testing positive will sum up to 1. We use logistic function or sigmoid function to calculate probability in logistic regression. The logistic function is a simple S-shaped curve used to convert data into a value between 0 and 1.
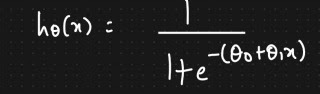
Best fitted line for logistic regression is :


Here we use same line formula were we used in linear regression, with in we apply sigmoid function. To get the output with in 0 to 1, Here there is an another topic called as threshold were we can classify the two outcome. Threshold can be selected through AUC and ROC by business problem.


Here which lead to obtain the global minima by gradient decent algorithm, Which having convex function.

But for Logistic Regression, if we use MSE it leads to having local minima.

Here which lead to obtain the local minima by gradient decent algorithm, Which having non convex function.

So to obtain the global minima there is another cost function:
Log Loss or Logit cost function:

To Minimize the cost function:

Conclusion
In this blog, I have presented you with the basic concept of Logistic Regression. I hope this blog was helpful and would have motivated you enough to get interested in the topic.


Comments
Post a Comment